Import and merge any database
Scopus, Web of Science, PubMed, Dimensions, Lens.org, OpenAlex, RIS and BibTeX. Several files are merged and duplicates removed automatically.
Drop in your Scopus, Web of Science, PubMed, Dimensions, Lens or OpenAlex exports. Bibliometrics Studio merges them, removes duplicates, and gives you every standard bibliometric indicator and science map, with tables and figures ready for your review paper.
Performance analysis and science mapping in one place, from data cleaning to publication-ready figures, without installing R, Java or a desktop program.
Scopus, Web of Science, PubMed, Dimensions, Lens.org, OpenAlex, RIS and BibTeX. Several files are merged and duplicates removed automatically.
Main information, annual growth, the most relevant sources, authors, affiliations and countries, Bradford’s and Lotka’s laws, and h-, g- and m-index.
Keyword co-occurrence, co-citation, bibliographic coupling and co-authorship, with network, overlay and density views, Louvain clusters and centrality measures.
Motor, niche, emerging and basic themes from Callon’s centrality and density, and a Sankey diagram of how themes evolve across periods.
Historiograph, reference publication year spectroscopy, trend topics, Kleinberg burst detection, factorial analysis and clustering by coupling.
Word report with figures and APA tables, Excel workbook, HTML, SVG and 300-dpi PNG, plus VOSviewer, Pajek, GraphML and Gephi files and a PRISMA diagram.
Save your search results from Scopus, Web of Science, PubMed or another database. Step-by-step export guide.
Drop the files in. Merge synonyms, remove generic keywords, and filter by year, document type or language.
Every page has a figure, the full table and a short explanation of how to read it, with options to tune.
Download a Word report or single figures and tables, copy the methods paragraph, and cite the software.
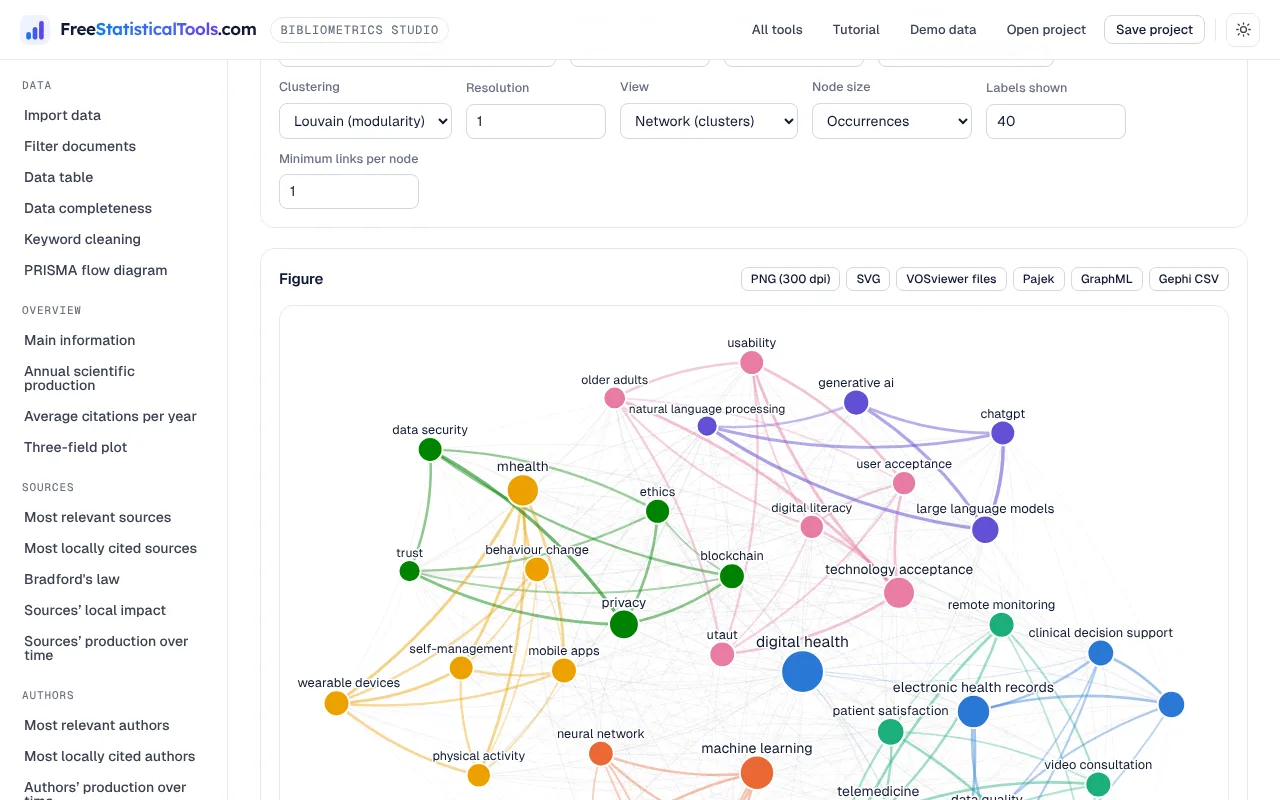
Choose the items (keywords, references, authors, sources, countries), the normalisation (association strength, Salton, Jaccard) and the clustering resolution. Switch between the network, overlay-by-year and density views, and hover any node for its numbers.
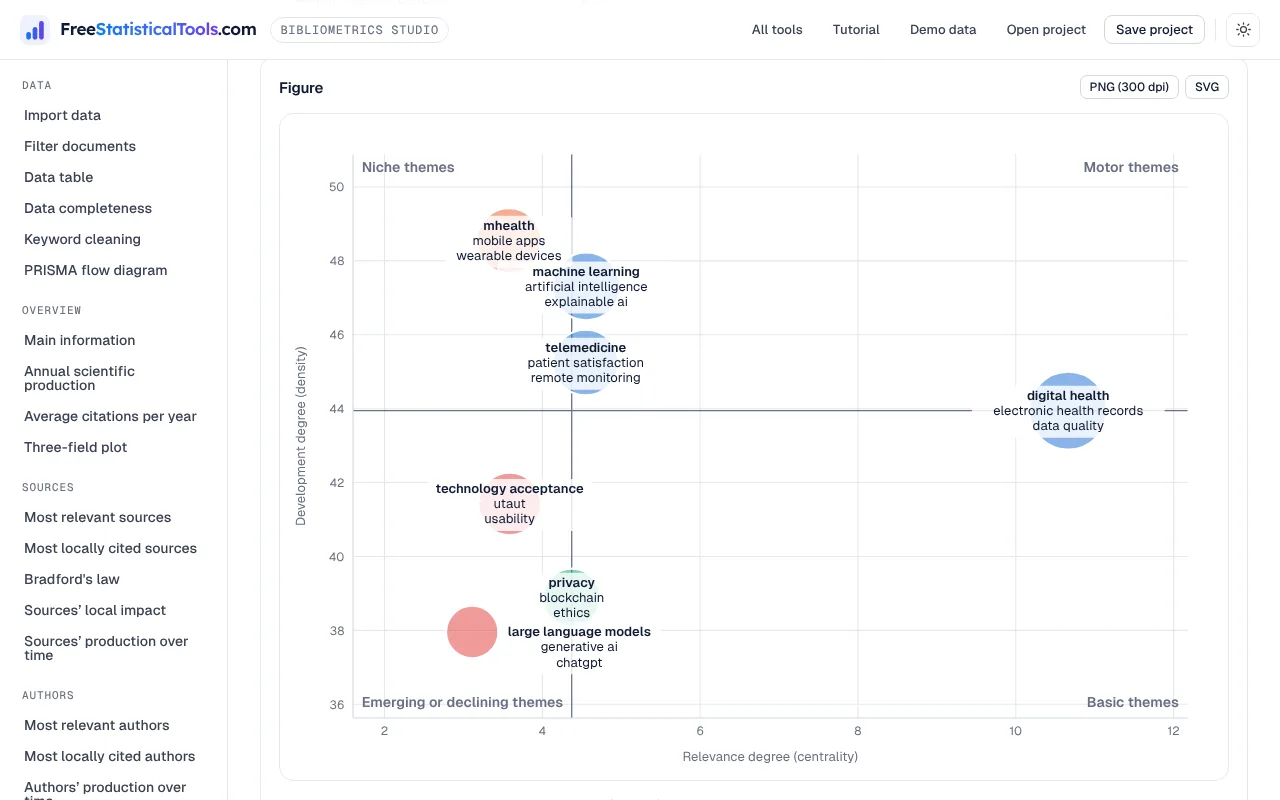
The thematic map places each theme by how central and how developed it is. Thematic evolution links the themes of successive periods. Factorial analysis and the topic dendrogram show how keywords group into topics.
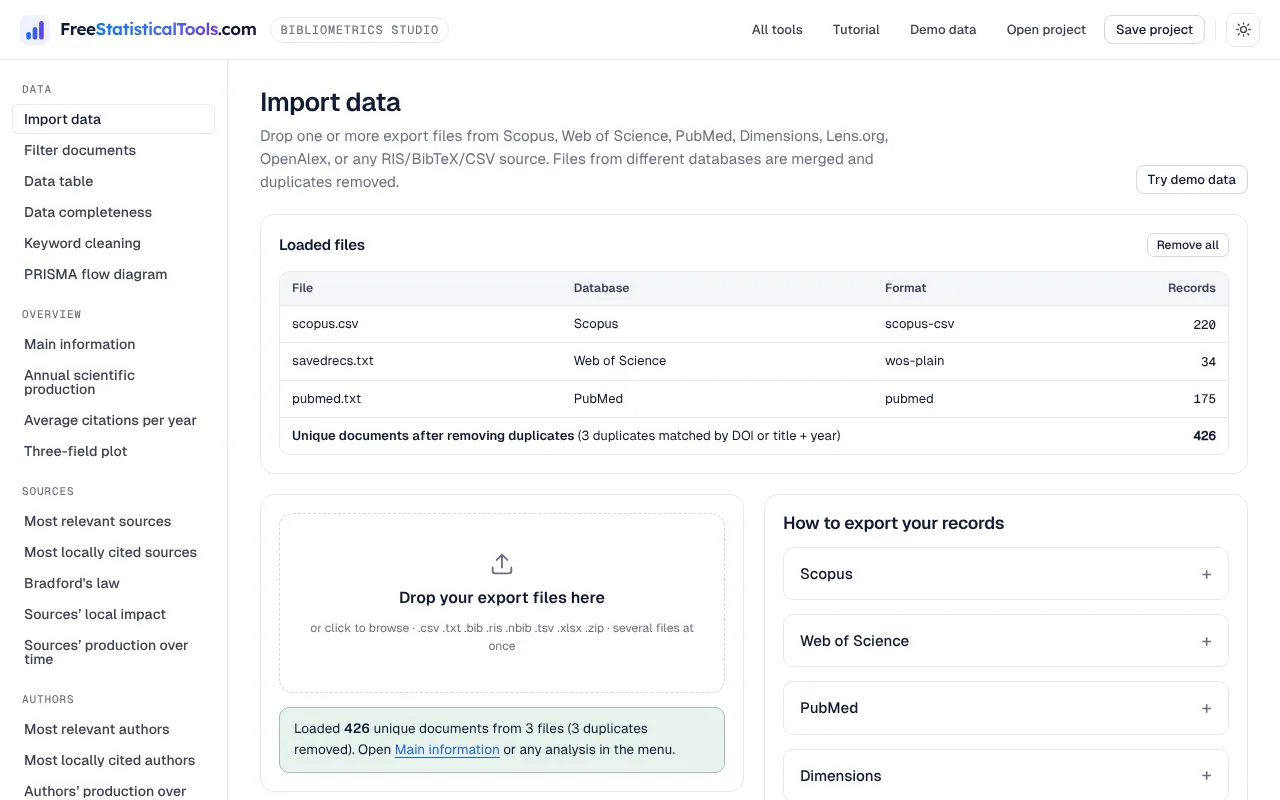
Web of Science and Scopus overlap heavily. Bibliometrics Studio matches duplicates by DOI, then by normalised title and year, keeps the most complete version of each record, and shows exactly how many were removed. A completeness table tells you which fields each analysis can rely on.
Bibliometrics Studio covers the analyses most bibliometric reviews report, in the browser, at no cost. Product names are trademarks of their owners and are used only for comparison.
| What you need | Bibliometrics Studio | Typical alternatives |
|---|---|---|
| Price | Free | Free open-source to paid subscriptions |
| Installation | None, runs in the browser | R and packages, Java, or a desktop program |
| Merge Scopus, Web of Science, PubMed and others | Drop the files in | Often scripts or manual steps |
| Performance analysis and laws | Built in | Varies by tool |
| Network, overlay and density maps | Built in | Usually a separate mapping tool |
| Thematic map, evolution, historiograph, bursts | Built in | Spread across several tools |
| Word report with figures and tables | One click | Rarely |
| PRISMA 2020 flow diagram | Filled in from your imports | Separate tool |
Yes. Every analysis and export is free, with no account, no trial and no limit on the number of records. It runs entirely in your web browser.
No. Your Scopus, Web of Science, PubMed or other files are read and analysed inside your browser tab. Nothing is sent to our server.
Scopus (CSV, BibTeX, RIS), Web of Science (plain text, tab-delimited, BibTeX, Excel), PubMed (MEDLINE/PubMed format and CSV), Dimensions (CSV or Excel), Lens.org (CSV), OpenAlex (CSV), and RIS or BibTeX files from Google Scholar (via Publish or Perish), Zotero, Mendeley, EndNote, IEEE Xplore, EBSCO or ProQuest. Any CSV with a Title column also works.
Yes. Drop all your export files at once. Records are merged, and duplicates are removed by matching DOIs and normalised titles with publication years. The most complete version of each record is kept, and the number of duplicates removed is reported for your PRISMA diagram.
It covers the analyses researchers typically report from biblioshiny (the bibliometrix web interface) and VOSviewer: main information, sources, authors and countries, Bradford’s and Lotka’s laws, h-index, keyword co-occurrence, thematic maps and evolution, factorial analysis, co-citation, coupling, collaboration networks and historiographs, plus CiteSpace-style burst detection, all in the browser without installing R or Java. It is an independent implementation and is not affiliated with those projects.
Two references are co-cited when a later document cites both of them, so co-citation maps the intellectual base a field builds on. Two documents are bibliographically coupled when they cite the same references, so coupling groups current research into fronts. Bibliometrics Studio runs both, for references, authors, sources and countries.
Keywords are grouped into themes by clustering their co-occurrence network (Louvain algorithm on association-strength weights). Each theme is placed by Callon’s centrality, the strength of its links to other themes, and density, the strength of the links inside it (Callon et al., 1991; Cobo et al., 2011). The quadrants show motor, niche, emerging or declining, and basic themes.
Yes. Every network can be downloaded as VOSviewer map and network files, a Pajek .net file, GraphML, or Gephi node and edge CSVs. You can also export the merged data set in Web of Science format to open in VOSviewer, CiteSpace or bibliometrix.
Yes. The identification counts (records per database and duplicates removed) are filled in from your imports, and you enter the screening numbers. The PRISMA 2020 diagram can be saved as SVG or 300-dpi PNG.
Every table as CSV, Excel or copy-paste; every figure as SVG or 300-dpi PNG; a complete Word report with figures, APA-style tables, a methods paragraph and method references; an Excel workbook with all tables; an HTML report; and a ZIP with all figures and tables.
Please cite the software whenever you use it in research: Xavier, B. (2026). Bibliometrics Studio: Free bibliometric analysis and science mapping software [Web application]. FreeStatisticalTools.com. https://freestatisticaltools.com/bibliometric-analysis/ A BibTeX entry is in the How to cite section of this page, and the app writes a methods paragraph that cites the original method papers.
Bibliometrics Studio was created by Bibin Xavier as part of FreeStatisticalTools.com, together with CB-SEM Studio, PLS-SEM Studio and more than 90 other free statistical tools.
The tool is free because researchers support it by citing it. Whenever you use Bibliometrics Studio for a thesis, review article, conference paper or report, please cite the software and this website.
Xavier, B. (2026). Bibliometrics Studio: Free bibliometric analysis and science mapping software [Web application]. FreeStatisticalTools.com. https://freestatisticaltools.com/bibliometric-analysis/
@software{xavier_bibliometrics_2026,
  author = {Xavier, Bibin},
  title = {{Bibliometrics Studio}: Free Bibliometric Analysis and Science Mapping Software},
  publisher = {FreeStatisticalTools.com},
  year = {2026},
  url = {https://freestatisticaltools.com/bibliometric-analysis/},
  note = {Web application}
}
Suggested sentence for your methods section: “Bibliometric analysis and science mapping were performed with Bibliometrics Studio (Xavier, 2026), available at https://freestatisticaltools.com/bibliometric-analysis/.” The app also writes a full methods paragraph that cites the original method papers.
Bibliometrics Studio is part of FreeStatisticalTools.com.
Free, private and ready in seconds. Bring your database exports, or explore the demo data first.