Drag-and-drop model builder
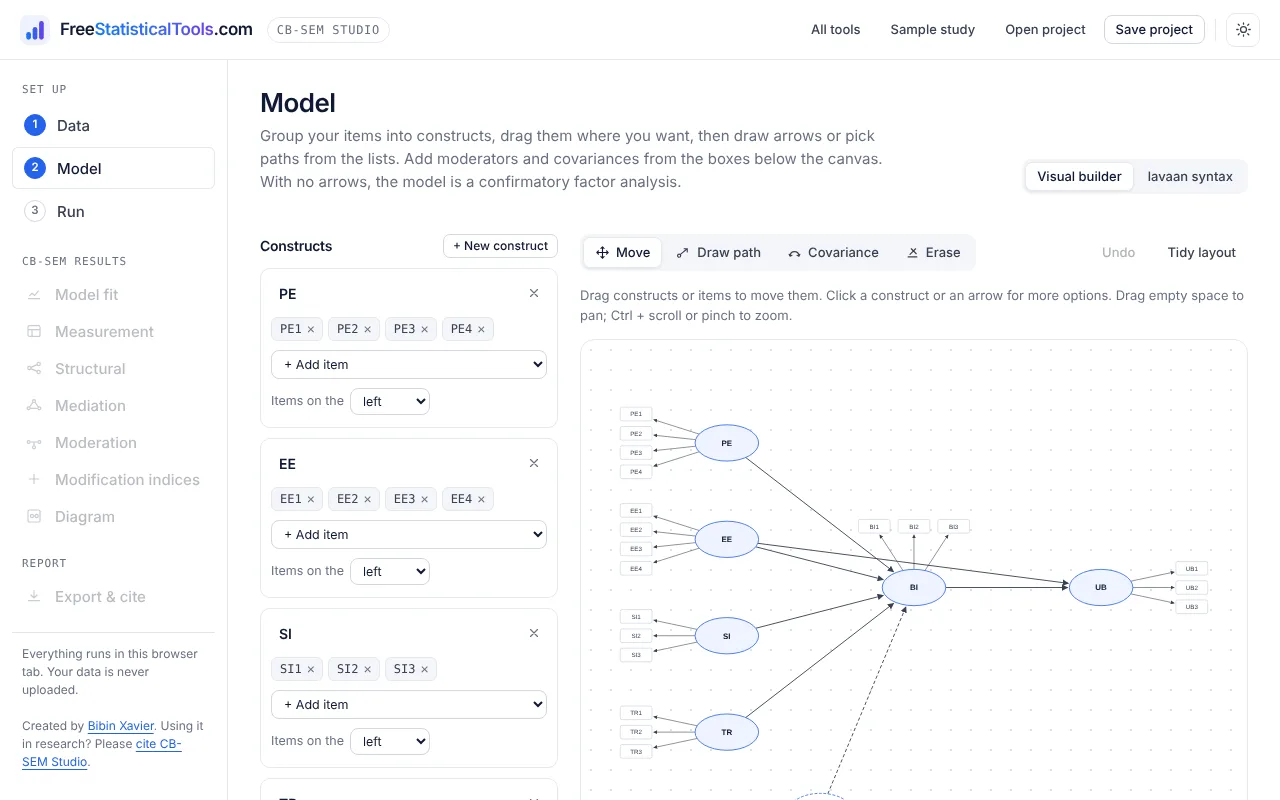
Create constructs from your items, drag them into place, set each construct’s item direction, add or remove items, and draw or pick paths from drop-down lists.
Covariance-based structural equation modeling without writing code. Draw constructs and arrows, click Run, and get model fit, standardized loadings, reliability and validity, path coefficients, indirect effects and modification indices, ready for your thesis or journal article.
The complete covariance-based structural equation modeling workflow, from data screening to publication-ready tables, with a visual model builder instead of syntax.
Create constructs from your items, drag them into place, set each construct’s item direction, add or remove items, and draw or pick paths from drop-down lists.
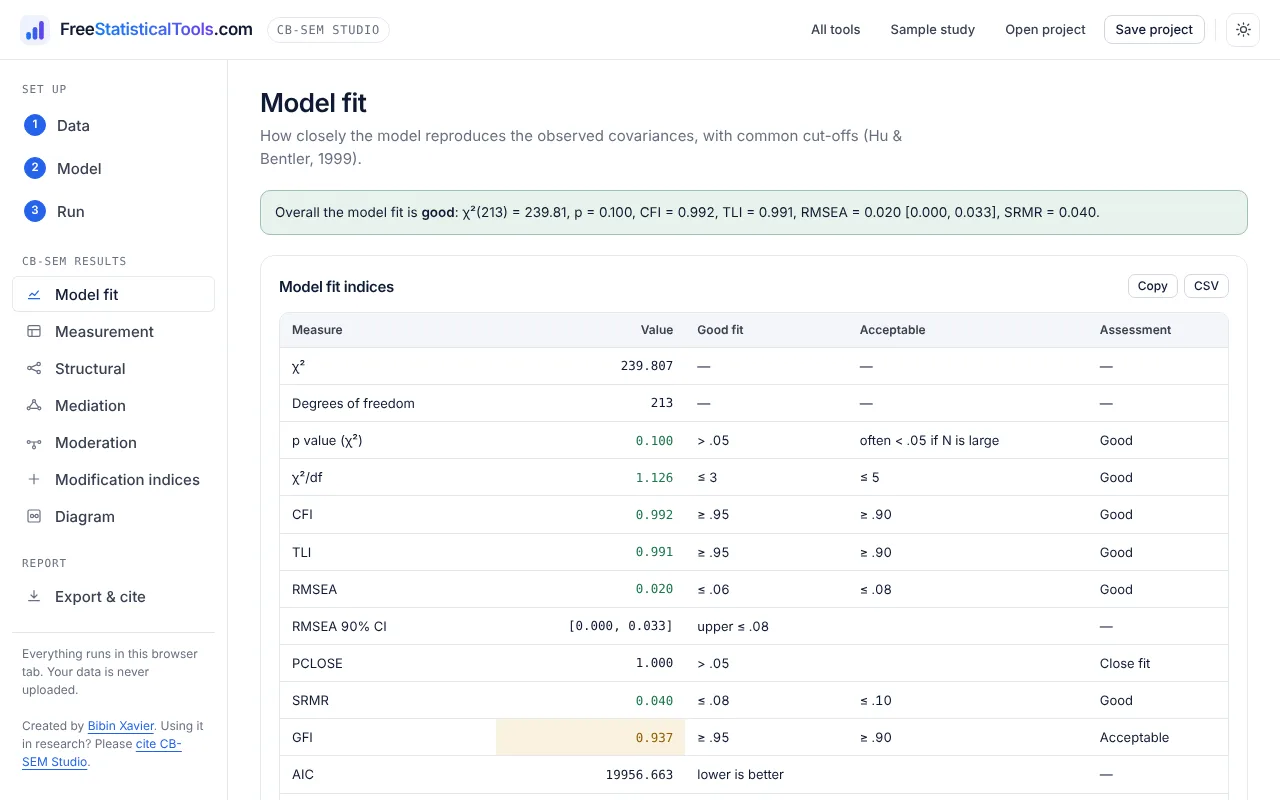
χ², χ²/df, CFI, TLI, RMSEA with 90% CI and PCLOSE, SRMR, GFI, AIC and BIC, flagged against Hu and Bentler’s cut-offs.
Standardized loadings, Cronbach’s α, composite reliability, AVE, MSV, HTMT and Fornell–Larcker for confirmatory factor analysis.
Every indirect route with Monte Carlo confidence intervals, plus latent interactions picked from drop-down lists, with simple slopes and moderated mediation.
The largest MIs with expected parameter changes, and one-click residual covariances between items of the same construct.
Word, Excel, HTML, CSV, LaTeX, JSON and lavaan syntax, a 300 dpi diagram and a drafted methods paragraph.
Drop in a CSV or Excel file. Descriptives, skewness, kurtosis and Mardia’s multivariate normality test appear at once.
Group items such as TR1, TR2, TR3 into constructs with one click, then draw arrows for hypotheses and two-headed arrows for covariances.
The model is estimated in seconds with standard errors, fit indices, indirect effects and modification indices.
Check fit and validity, free a justified residual covariance if needed, then export tables, the diagram and the methods text.
No syntax to learn. Constructs are created from your item names, paths are drawn with two clicks, and covariances are added from a menu. If you prefer, edit the generated lavaan syntax directly.
Every table is flagged against widely used thresholds, so you can see immediately what passes and what needs attention.
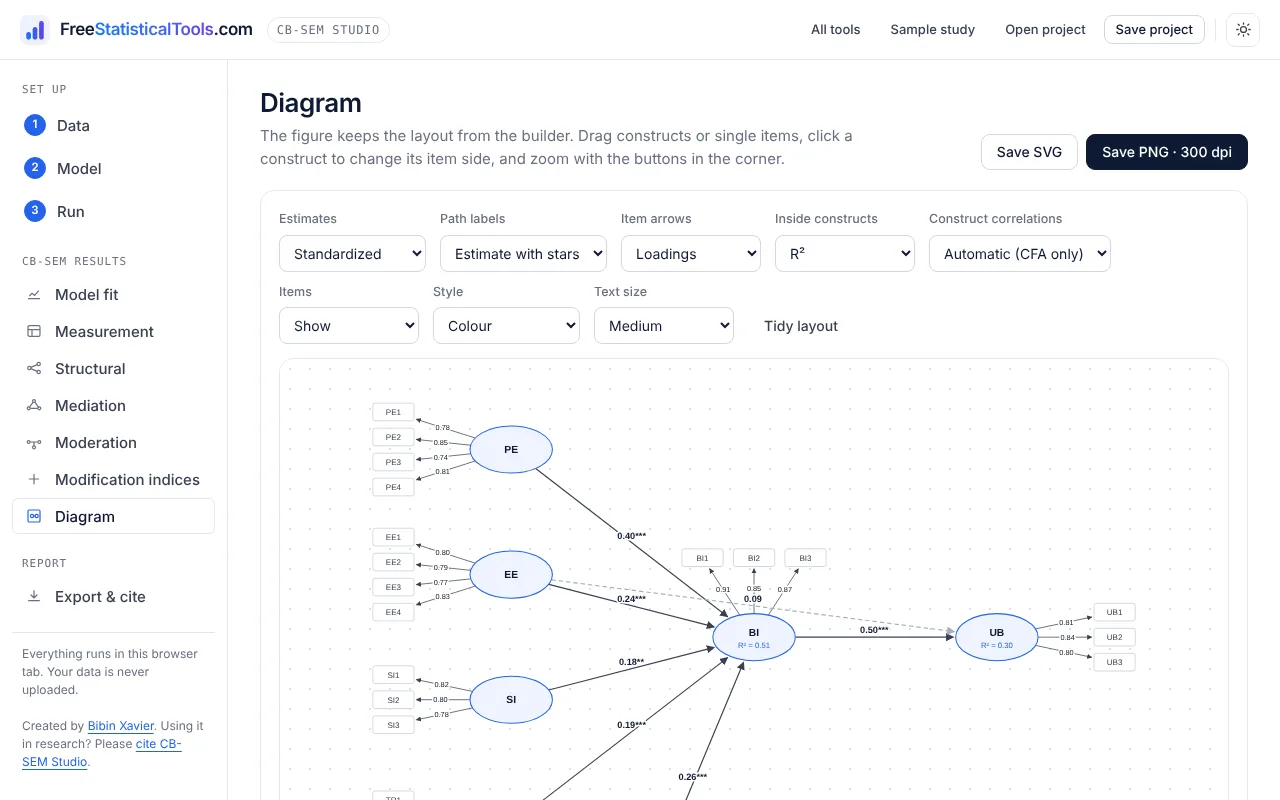
The diagram keeps your layout from the builder and shows standardized loadings, path coefficients with significance stars, covariances and R². Switch to black and white for journals and save it as SVG or a 300 dpi PNG.
CB-SEM Studio covers the analyses most theses and journal articles report, in the browser, at no cost.
| What you need | CB-SEM Studio | Typical desktop SEM software |
|---|---|---|
| Price | Free | Paid licence |
| Installation | None, runs in the browser | Download and install |
| Draw the model graphically | Yes | Some programs |
| Maximum likelihood estimation and fit indices | Included | Included |
| CR, AVE, MSV and HTMT tables | Built in | Often calculated by hand or with plugins |
| Indirect effects with confidence intervals | Automatic for every route | Needs setup |
| Word, Excel and LaTeX tables | One click | Varies |
Yes. Every feature is free, with no account, no trial period and no limits on sample size or model size. It runs entirely in your web browser.
No. Your data file is read and analysed inside your browser tab. Nothing is sent to our server, so confidential survey data stays on your computer.
For the standard CB-SEM workflow, yes: you draw the model as you would in AMOS, estimate it by maximum likelihood, and get model fit, standardized and unstandardized estimates, R², indirect effects and modification indices. Commercial packages offer more, such as multigroup invariance testing, Bayesian SEM and full information maximum likelihood for missing data. Results follow the same maximum likelihood method as lavaan and AMOS; the modification indices reproduce lavaan’s published values.
CB-SEM estimates common factors and tests how well the whole model reproduces the observed covariance matrix, so it reports global fit indices such as CFI, TLI and RMSEA. PLS-SEM builds composites and maximises explained variance, which suits prediction, formative constructs and small samples. Use CB-SEM to confirm a theory; use the free PLS-SEM Studio when prediction is the goal.
Chi-square with degrees of freedom and p value, normed chi-square (χ²/df), CFI, TLI, RMSEA with its 90% confidence interval and PCLOSE, SRMR, GFI, AIC and BIC, each flagged against the common cut-offs of Hu and Bentler (1999).
Draw the paths, for example X → M → Y and X → Y. Every indirect route is found automatically and tested with a Monte Carlo confidence interval (Preacher and Selig, 2012) as well as the delta-method standard error, and the result is classified as full, partial or no mediation (Zhao, Lynch and Chen, 2010).
In the Moderation box of the model builder, choose the moderator and the path it changes. CB-SEM Studio builds a latent interaction from double-mean-centred matched-pair product indicators (Marsh, Wen and Hau, 2004; Lin et al., 2010), adds the moderator’s main effect, and reports the interaction effect, simple slopes at ±1 SD with Monte Carlo confidence intervals, a simple slope plot and, where a moderated path is part of an indirect route, the index of moderated mediation.
A modification index estimates how much the chi-square would drop if a fixed parameter, such as a residual covariance or a cross-loading, were freed. CB-SEM Studio lists them with the expected parameter change, and residual covariances between items of the same construct can be added with one click. Only free parameters that make theoretical sense, and report every change.
Yes. For each construct you get standardized loadings, Cronbach’s alpha, composite reliability (CR), average variance extracted (AVE), maximum shared variance (MSV), the HTMT ratio and the Fornell–Larcker criterion, each flagged against common thresholds (Hair et al., 2019; Henseler et al., 2015).
Import CSV, TSV, TXT, XLSX, XLS and ODS files. Export every table to Excel, Word, HTML, CSV and LaTeX, the full results to JSON, the model as lavaan syntax, and the path diagram as SVG or 300 dpi PNG.
Please cite the software whenever you use it in research: Xavier, B. (2026). CB-SEM Studio: Free covariance-based structural equation modeling software [Web application]. FreeStatisticalTools.com. https://freestatisticaltools.com/cb-sem/ A BibTeX entry is in the How to cite section of this page.
CB-SEM Studio was created by Bibin Xavier as part of FreeStatisticalTools.com, together with the free PLS-SEM Studio and more than 90 other statistical tools.
The tool is free because researchers support it by citing it. Whenever you use CB-SEM Studio for a thesis, article, conference paper or report, please cite the software and this website.
Xavier, B. (2026). CB-SEM Studio: Free covariance-based structural equation modeling software [Web application]. FreeStatisticalTools.com. https://freestatisticaltools.com/cb-sem/
@software{xavier_cbsem_2026,
  author = {Xavier, Bibin},
  title = {{CB-SEM Studio}: Free Covariance-Based Structural Equation Modeling Software},
  publisher = {FreeStatisticalTools.com},
  year = {2026},
  url = {https://freestatisticaltools.com/cb-sem/},
  note = {Web application}
}
Suggested sentence for your methods section: “The model was estimated by maximum likelihood with CB-SEM Studio (Xavier, 2026), available at https://freestatisticaltools.com/cb-sem/.”
CB-SEM Studio is part of FreeStatisticalTools.com. These tools cover the analyses that usually sit around a structural equation model.
Free, private and ready in seconds. Bring a CSV or Excel file, or explore the sample study first.