Measurement model
Loadings, weights, Cronbach's alpha, ρA, composite reliability, AVE, HTMT, Fornell–Larcker and cross-loadings, with every threshold flagged.
Build your structural equation model by drawing it, then get measurement and structural results, mediation, moderation and fuzzy-set QCA in one place. Every table is ready for your thesis or journal article.
The complete partial least squares structural equation modeling workflow, from data screening to publication-ready tables, without writing code.
Loadings, weights, Cronbach's alpha, ρA, composite reliability, AVE, HTMT, Fornell–Larcker and cross-loadings, with every threshold flagged.
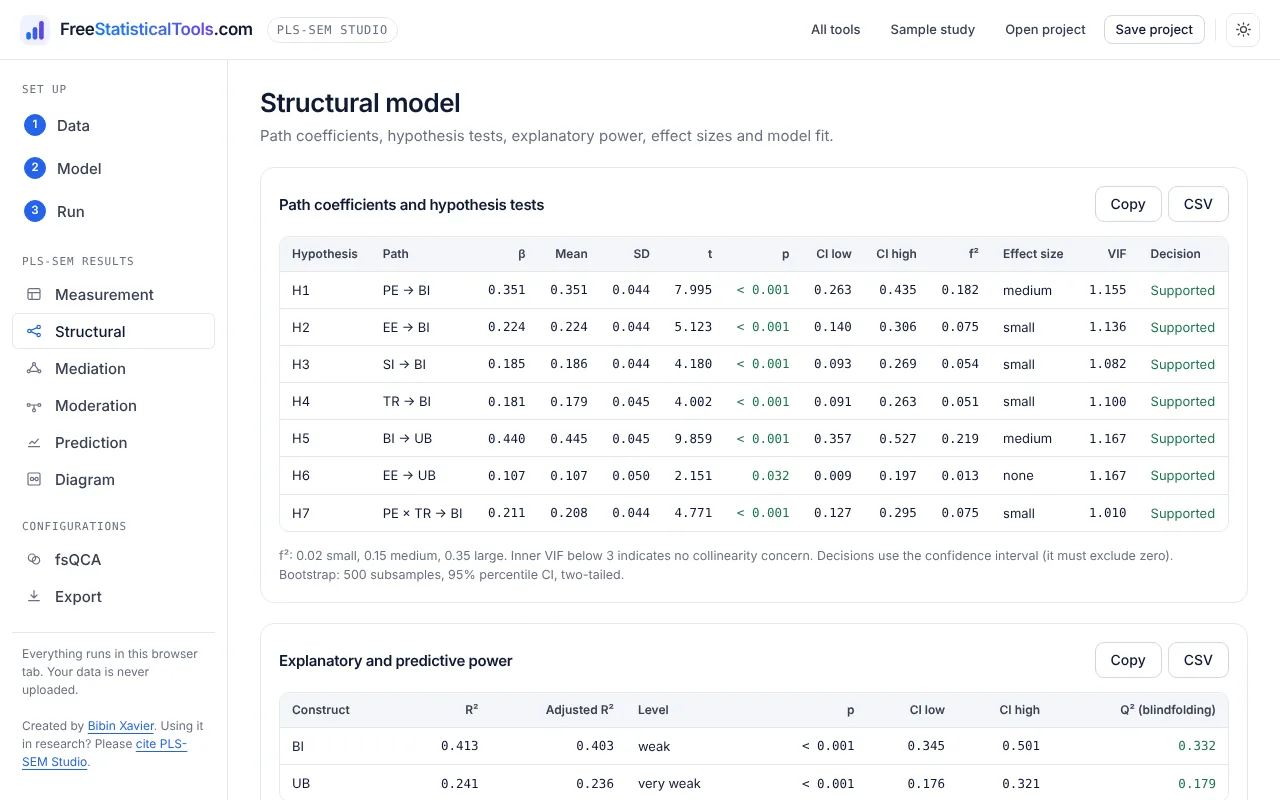
Path coefficients with bootstrapped t, p and confidence intervals, R², f², VIF, SRMR and hypothesis decisions.
Specific, total and serial indirect effects, found automatically and classified by mediation type.
Two-stage interaction terms, simple slopes, slope plots, conditional indirect effects and the index of moderated mediation.
Calibrate latent variable scores, test necessity, build the truth table and get complex, parsimonious and intermediate solutions.
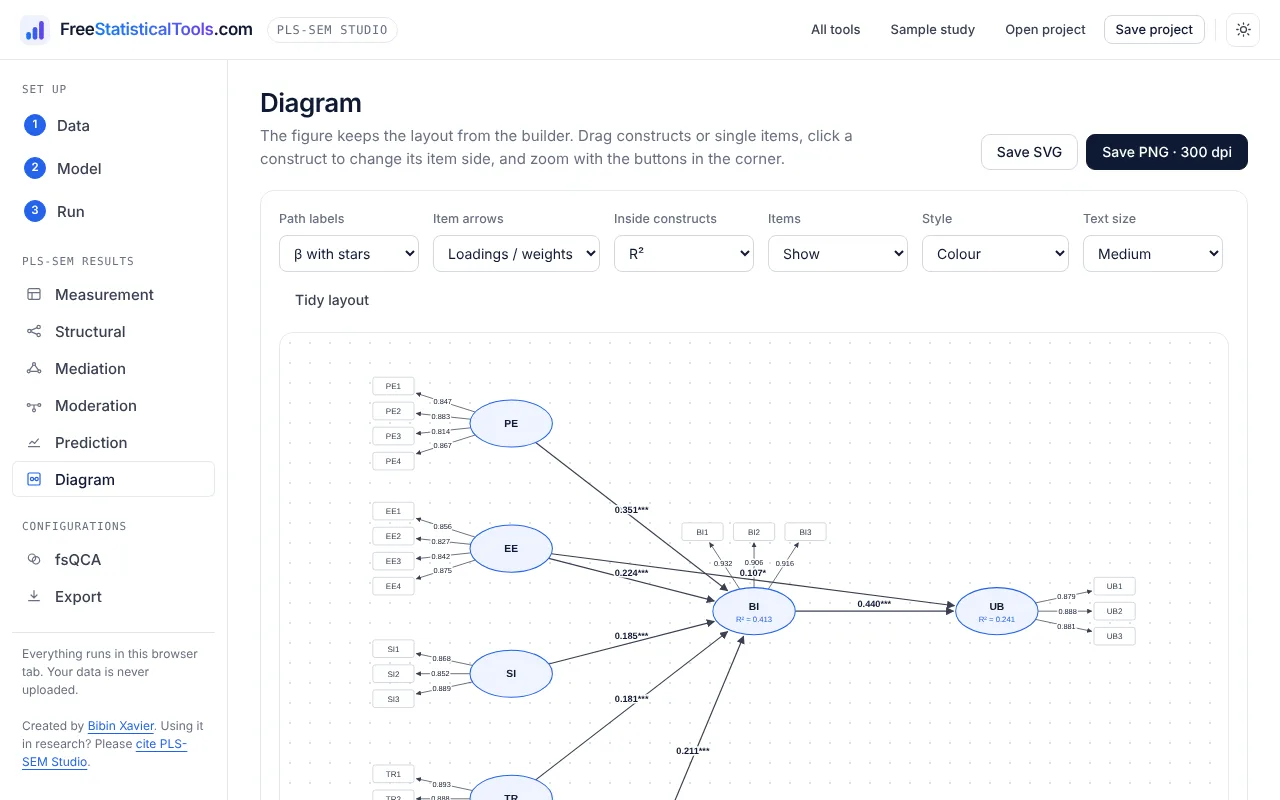
Word, Excel, HTML, CSV, LaTeX and JSON, a 300 dpi path diagram, and a drafted methods paragraph.
Drop in a CSV or Excel file. Descriptive statistics, skewness and kurtosis appear right away.
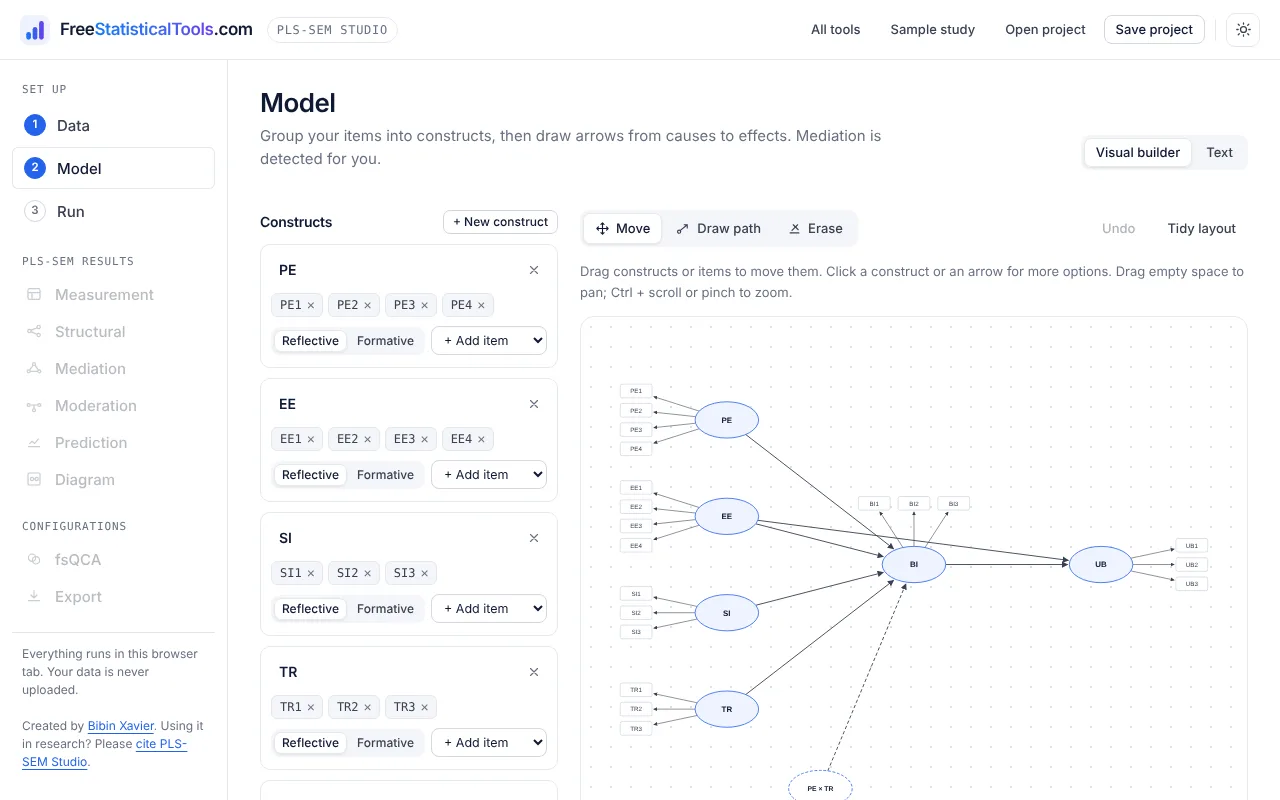
Items named like TR1, TR2, TR3 are grouped into constructs with one click. Then draw arrows from causes to effects.
Estimation, bootstrapping, blindfolding and PLSpredict run in the background in seconds.
Download the tables and the figure, copy the methods paragraph, and add fsQCA if your study calls for it.
You do not need to learn syntax. Constructs are created from your item names, paths are drawn with two clicks, and moderators are added by choosing the path they change.
Every table follows Hair, Hult, Ringle and Sarstedt (2022) and is flagged against common thresholds, so you can see at a glance what passes and what needs attention.
Many journals now ask authors to complement PLS-SEM with fuzzy-set qualitative comparative analysis. Here it takes one more click, using the construct scores you just estimated.
PLS-SEM Studio covers the analyses most theses and journal articles report, in the browser, at no cost.
| What you need | PLS-SEM Studio | Typical desktop PLS software |
|---|---|---|
| Price | Free | Paid licence or limited free tier |
| Installation | None, runs in the browser | Download and install |
| Data privacy | Data stays on your device | Local |
| Measurement and structural model | Included | Included |
| Mediation and moderation | Included, with automatic mediation types | Included |
| PLSpredict and SRMR | Included | Included in most |
| fsQCA on latent variable scores | Built in | Separate software needed |
| Word, Excel and LaTeX tables | One click | Varies |
Yes. Every feature is free with no trial period, no account and no limits on sample size, number of constructs or bootstrap subsamples. It runs entirely in your web browser.
No. Your data file is read and analysed inside your browser tab. Nothing is sent to our server, so you can analyse confidential survey data safely. Closing the tab clears it unless you save a project file to your own computer.
For the core PLS-SEM workflow, yes: reflective and formative measurement models, reliability and validity, HTMT, bootstrapping, mediation, moderation, PLSpredict and model fit. Importance-performance map analysis (IPMA and cIPMA) and necessary condition analysis (NCA) are available as separate free tools on FreeStatisticalTools.com. Commercial packages such as SmartPLS offer further methods, for example multigroup analysis, CTA-PLS, higher-order construct wizards and endogeneity tests. PLS-SEM Studio adds fsQCA on the latent variable scores, which most PLS tools do not include.
Outer loadings and weights, indicator VIF, Cronbach's alpha, rho_A, composite reliability (rho_C), AVE, Fornell–Larcker, HTMT with confidence intervals, cross-loadings, path coefficients with t and p values, R², adjusted R², f², inner VIF, SRMR, total effects, blindfolding Q² and PLSpredict with a linear-model benchmark.
Draw the paths of your mediation model, for example X → M → Y and X → Y. The app finds every indirect route, including serial and parallel mediation, tests it with bootstrap confidence intervals and classifies the result as complementary, competitive, indirect-only, direct-only or no effect (Zhao, Lynch and Chen, 2010).
In the model builder, choose a moderator and the path it changes. The interaction term is created with the two-stage approach. You get the interaction effect, its f², simple slopes at one standard deviation below and above the mean, a simple slope plot and, where relevant, conditional indirect effects with the index of moderated mediation.
Fuzzy-set qualitative comparative analysis (fsQCA) finds combinations of conditions that lead to an outcome, while PLS-SEM estimates the net effect of each predictor. Running fsQCA on the PLS latent variable scores shows several equifinal paths to the outcome and is increasingly expected in management, marketing, tourism and information systems journals.
Import CSV, TSV, TXT, XLSX, XLS and ODS files. Export all tables to Excel, Word (.docx), HTML, CSV and LaTeX, the full results to JSON, the latent variable scores to CSV and the path diagram to SVG or 300 dpi PNG.
Use 5,000 subsamples for final results, as recommended by Hair et al. (2022). 500 or 1,000 are fine for a quick first look. A typical model with 300 cases finishes 5,000 subsamples in well under a minute.
Please cite the software and the website whenever you use it in research: Xavier, B. (2026). PLS-SEM Studio: Free PLS-SEM and fsQCA software [Web application]. https://freestatisticaltools.com/pls-sem/ A BibTeX entry is provided in the How to cite section of the home page.
PLS-SEM Studio was created by Bibin Xavier as part of FreeStatisticalTools.com, a collection of more than 90 free statistical tools. You can connect with him on LinkedIn at linkedin.com/in/bibinxavier.
PLS-SEM builds constructs as weighted composites and maximises explained variance in the outcomes, so it suits prediction, complex models, formative constructs and smaller samples. CB-SEM estimates common factors and tests how well the model reproduces the covariance matrix, with fit indices such as CFI, TLI and RMSEA. If you need CB-SEM or a confirmatory factor analysis, use the free CB-SEM and CFA tools on FreeStatisticalTools.com.
Yes. The free data cleaning and coding tool on FreeStatisticalTools.com lets you set variable types and value labels, reverse-code items, handle missing values and remove duplicates, then download a clean CSV to open here.
Yes. Any modern browser works, including Chrome, Edge, Firefox and Safari on desktop, laptop and tablet. A larger screen is more comfortable for building diagrams.
The tool is free because researchers support it by citing it. Whenever you use PLS-SEM Studio for a thesis, article, conference paper or report, please cite the software and this website.
Xavier, B. (2026). PLS-SEM Studio: Free PLS-SEM and fsQCA software [Web application]. FreeStatisticalTools.com. https://freestatisticaltools.com/pls-sem/
@software{xavier_plssem_2026,
  author = {Xavier, Bibin},
  title = {{PLS-SEM Studio}: Free {PLS-SEM} and {fsQCA} Software},
  publisher = {FreeStatisticalTools.com},
  year = {2026},
  url = {https://freestatisticaltools.com/pls-sem/},
  note = {Web application}
}
Suggested sentence for your methods section: “The model was estimated with PLS-SEM Studio (Xavier, 2026), available at https://freestatisticaltools.com/pls-sem/.” Created by Bibin Xavier.
PLS-SEM Studio is part of FreeStatisticalTools.com. These tools cover the analyses that usually sit around a PLS-SEM model, from data preparation to covariance-based SEM.
Free, private and ready in seconds. Bring a CSV or Excel file, or explore the sample study first.